Healthcare · Enterprise SaaS · Provider Data Management
DataSpring Provider Data Portal — a scalable, accessible healthcare data experience
Turning complex provider-data workflows into a consistent, responsive, and implementation-ready experience.
- Role
- Senior UI/UX Designer
- Organization
- Wipro
- Client
- DataSpring (formerly CAQH)
- Duration
- 9+ Months
- Platforms
- Desktop, tablet, mobile
- Domain
- Healthcare · Enterprise SaaS
- Scope
- Research → IA → Flows → Design system → Handoff → UX QA
- Year
- 2026
01 · Overview
Accurate provider data keeps healthcare running.
Maintaining provider information across specialties, credentials, practice locations, hospital affiliations, documents and health-plan relationships is a complex operational challenge. At Wipro, I worked on the redesign of the DataSpring Provider Data Portal — formerly the CAQH Provider Data Portal — to evolve it into a more consistent, accessible and scalable experience for healthcare providers and internal users.
The work went beyond producing screens: making complex business rules understandable, keeping interactions consistent across a large product, and giving developers the clarity they needed to build the intended experience.
Translate a large, rules-heavy healthcare platform into coherent workflows — without losing the accuracy, governance and traceability the system requires.
9+ Months
Design engagement
1,000+
Screens designed
3
Breakpoints: desktop, tablet, mobile
End-to-end
Audit → flows → handoff → QA
These figures describe scope and process, not measured product outcomes.
02 · Understanding the product
One portal, four groups, overlapping data.
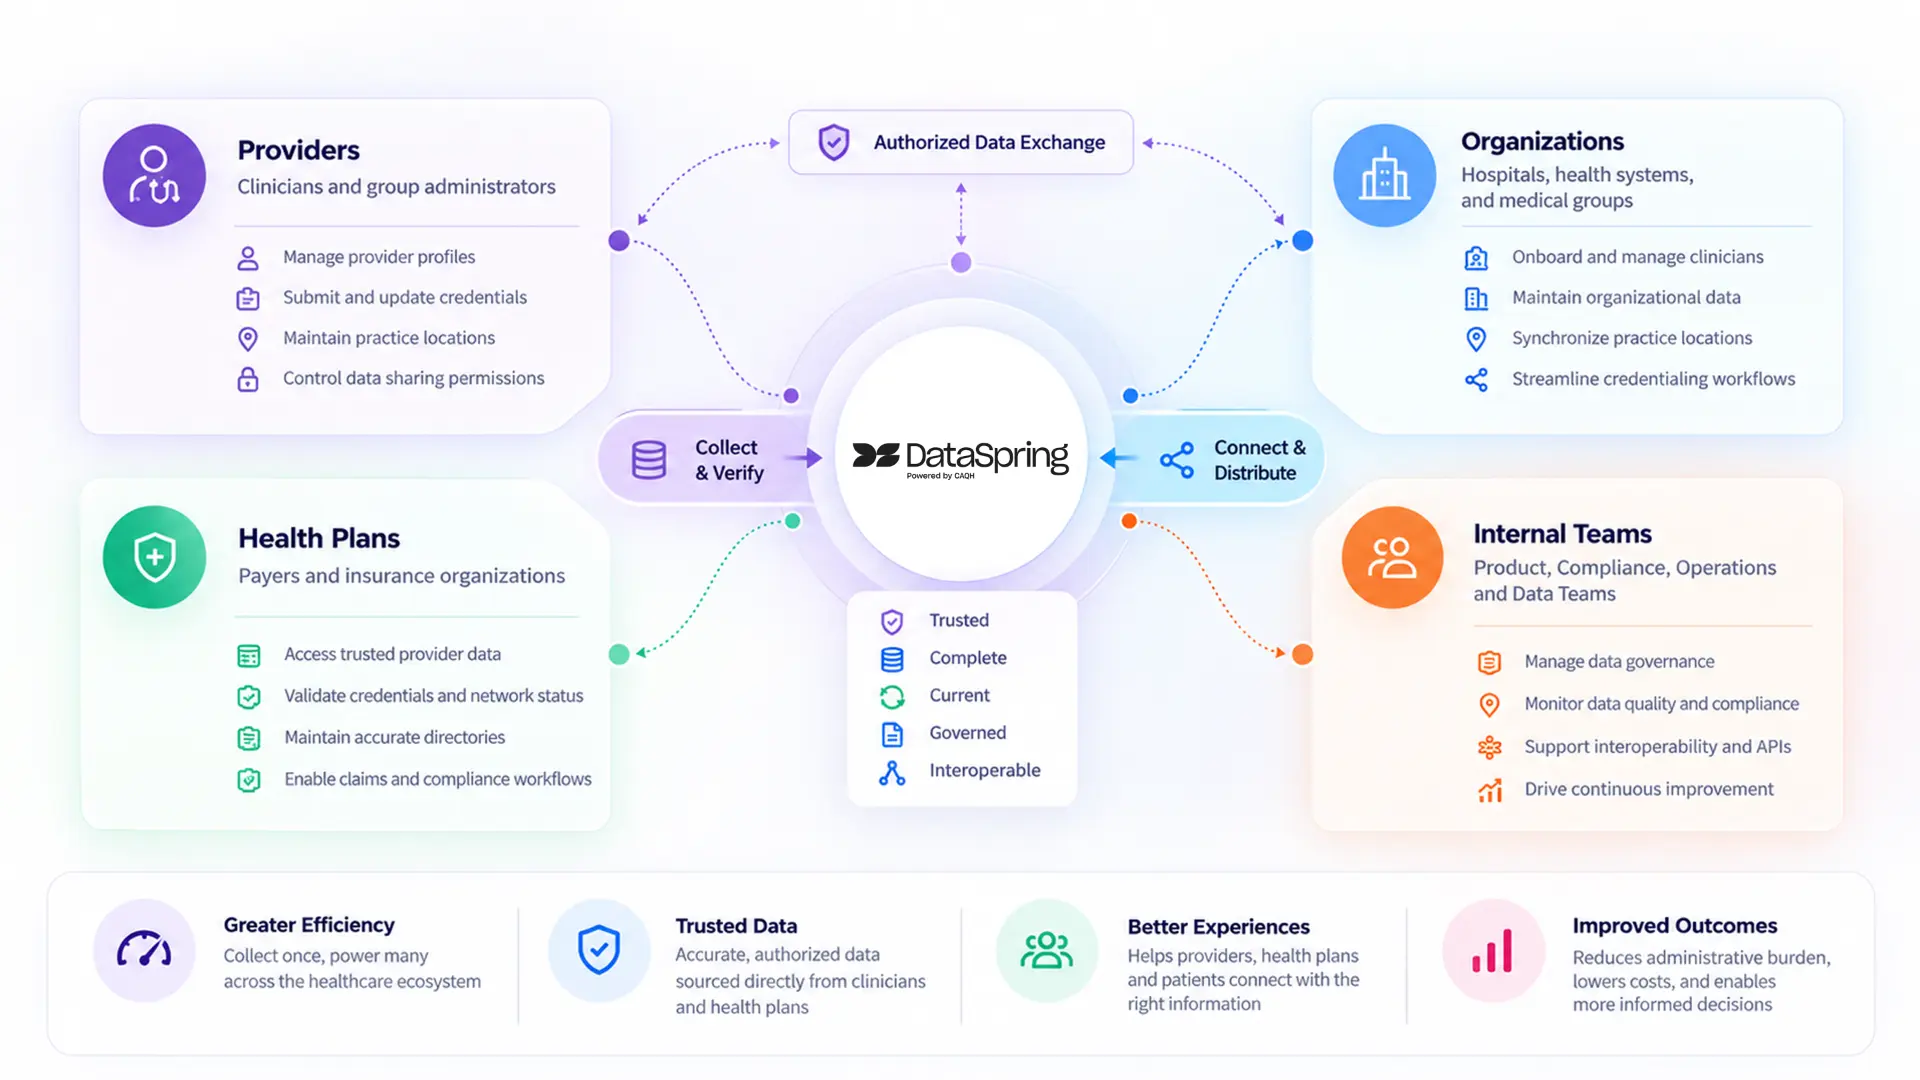
DataSpring, powered by CAQH, connects healthcare organizations through trusted provider and member data. The Provider Data Portal is the central place for provider-sourced information — used in credentialing, provider directories, network management and other essential workflows.
Healthcare providers
Maintain professional information, credentials, documents, affiliations and practice details.
Group admins & delegated organizations
Manage practitioners, shared records, locations, authorizations and roster submissions.
Health plans
Receive authorized provider information for downstream operational workflows.
Internal operations & support
Manage users, permissions, reporting and administrative processes.
The platform holds millions of provider records across 1,000+ participating organizations. These are platform-level figures that show the scale of the ecosystem — not outcomes of this redesign.
03 · The challenge
When every field carries a business rule.
Adding a specialty or editing a practice location could involve many dependencies. A specialty could determine taxonomy groupings and certification fields; a location could be owned by a practitioner or an organization; an authorization could decide whether a health plan sees specific data; a change of state could alter which questions apply.
1 · Interconnected information
Data spread across profiles, credentials, affiliations, locations, documents and plan relationships.
2 · Ownership & permissions
Some records were practitioner-owned, others group-managed; access depended on roles and authorization.
3 · Conditional validation
Required fields, duplicates, date rules, state-specific rules, expired credentials, failed submissions.
4 · Consistency at scale
1,000+ screens across features and breakpoints risked drift in forms, status and navigation.
5 · Design ↔ development gap
Developers needed validations, alternate states and system messages — not just happy paths.
04 · Goals & success criteria
Five goals guided the work.
Simplify complex workflows
Profile management, credentials, documents and admin tasks that are easier to follow.
Consistent foundation
Reusable components, predictable patterns and standard visual rules.
Responsive by design
Desktop, tablet and mobile — never an afterthought.
Data integrity & trust
Validation, permissions, ownership, confirmation and errors built into the experience.
Implementation clarity
Acceptance criteria, flows, screens and validation specs connected for developers.
How success was evaluated
- Consistency of components, spacing, typography, color and responsive behavior.
- Completeness of user flows, including validation, errors and alternate states.
- Alignment between approved Figma designs and the built product.
- Accessibility: contrast, keyboard interaction, touch targets and screen-reader support.
- Tracking, resolving and retesting UX defects before demos.
05 · Discovery & design audit
Starting with the existing experience.
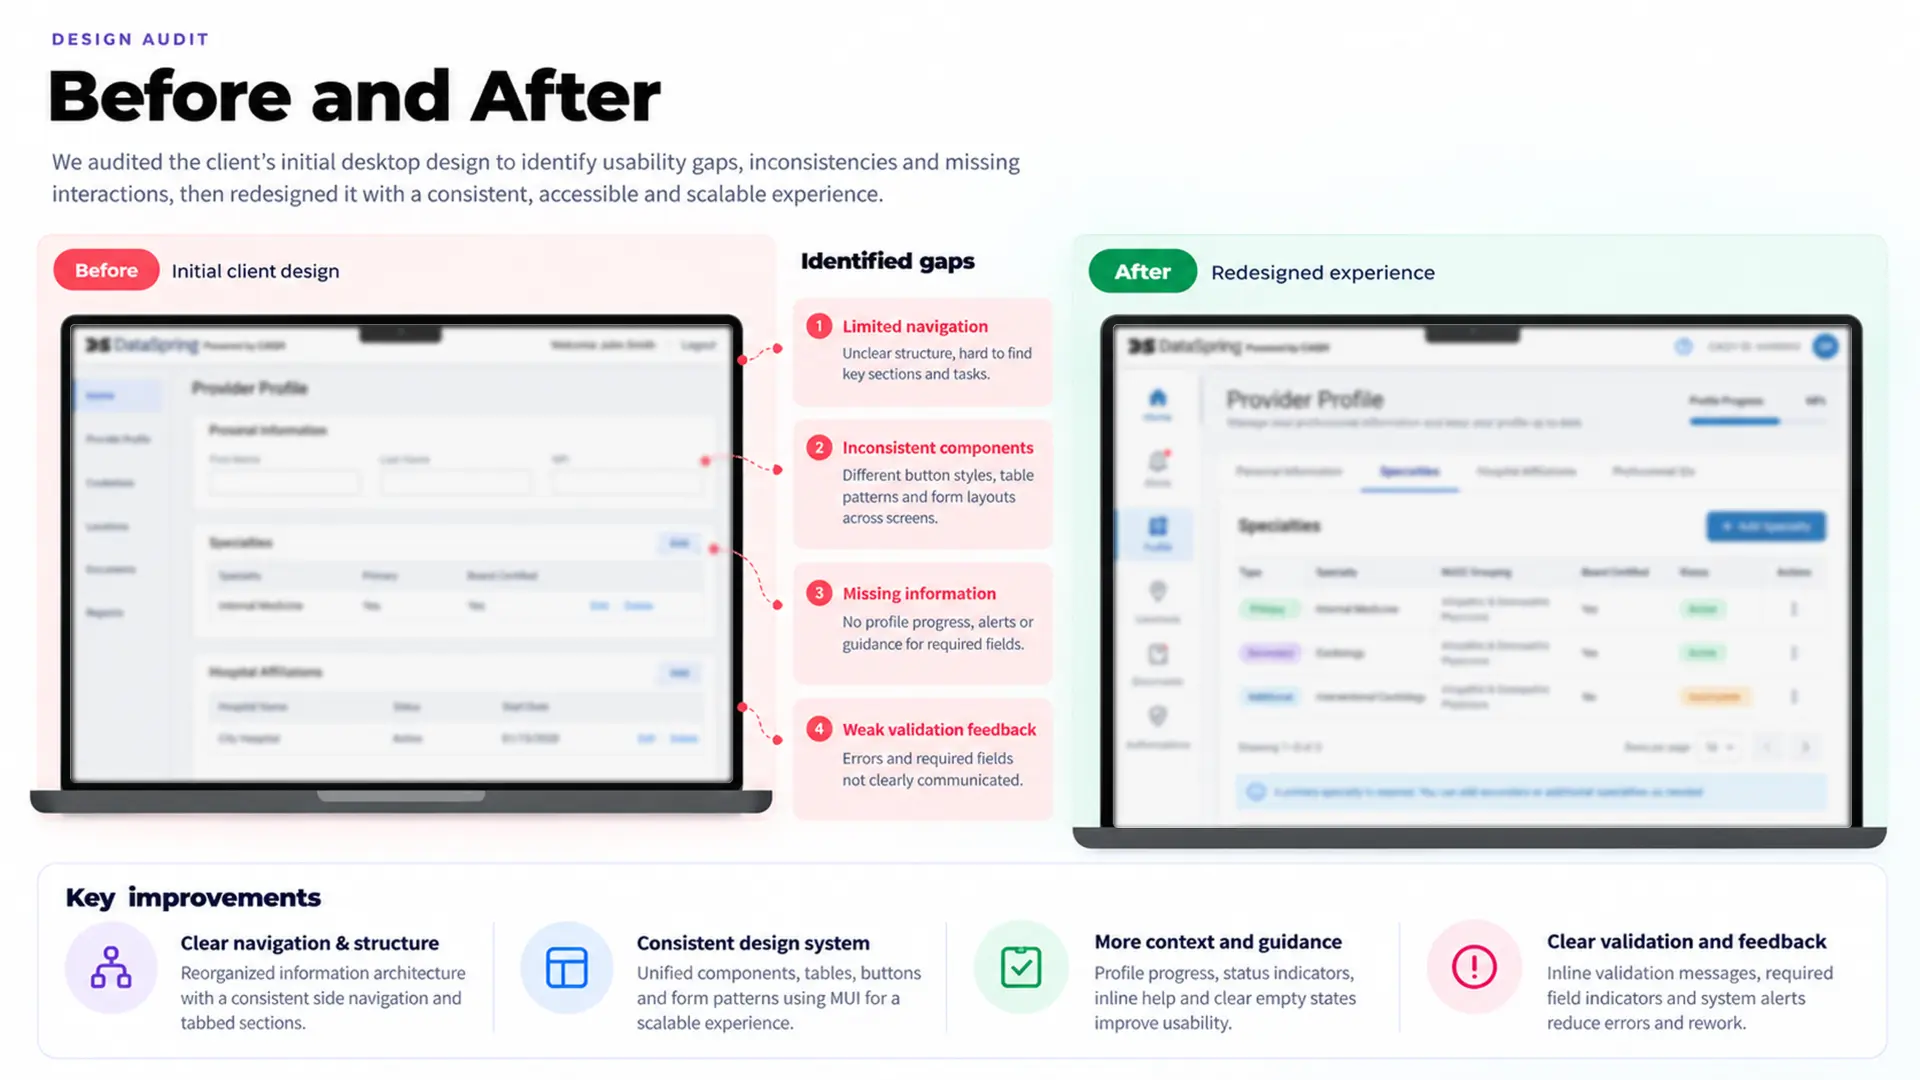
The client provided initial concepts and desktop designs. Rather than extending them straight away, I audited the existing experience to understand its structure, learned the healthcare terminology with help from internal QA knowledge and AI-assisted tools, and aligned with business and product stakeholders on next steps.
- Existing screens, navigation and information hierarchy.
- Gaps between the available designs and documented requirements.
- Inconsistent patterns across feature areas, and missing screens or interactions.
- Form behavior, validation requirements and system feedback.
- Opportunities for reusable patterns instead of one-off solutions.
06 · Requirements → user journeys
From acceptance criteria to predictable workflows.
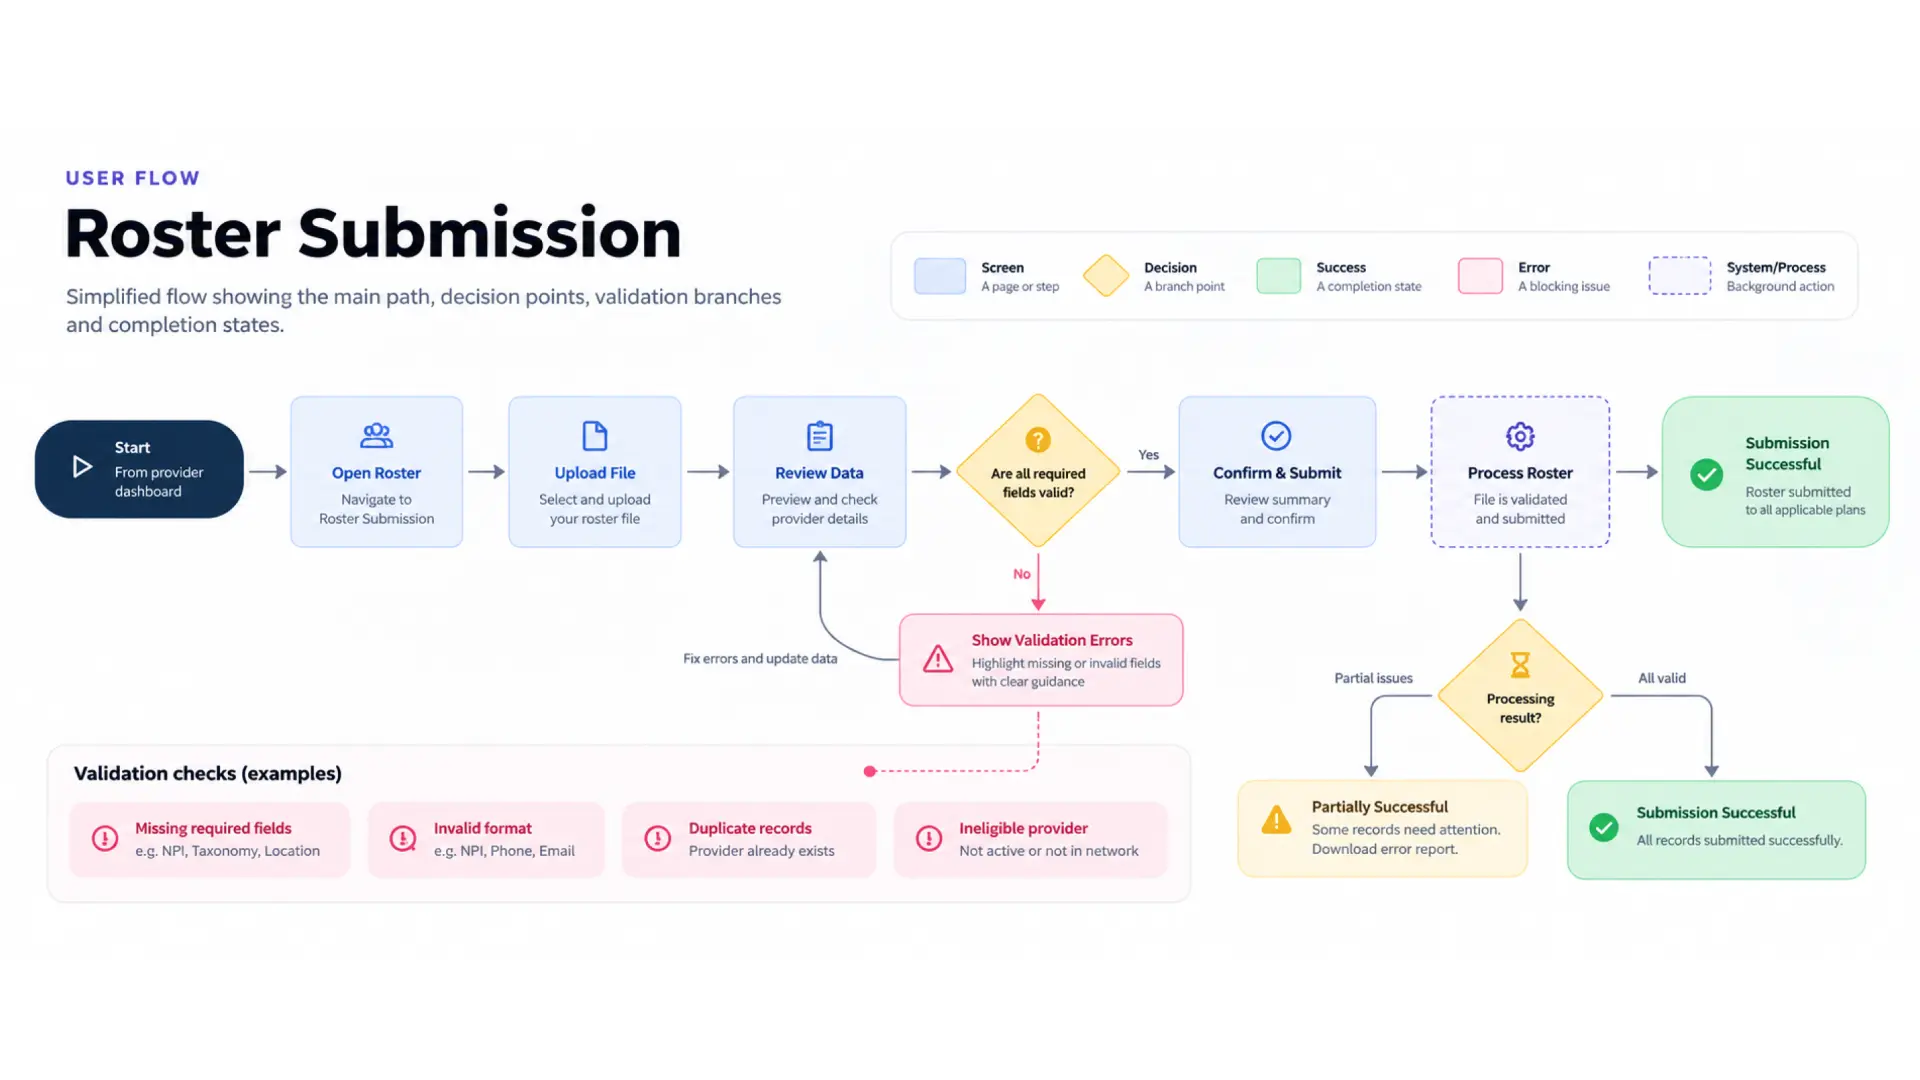
Requirements described far more than a successful interaction: prerequisites, role restrictions, conditional fields, validation failures, cancellation, confirmation, audit history and downstream effects. I mapped them as user-flow diagrams in Figma.
Example: submitting a practitioner roster
01
Check eligibility
Submit is available only to eligible delegated or hybrid organizations with active authorization.
02
Review readiness
Confirmation summarizes profile completeness and location assignments before submission.
03
Confirm the submission
The user selects authorized health plans and confirms the data exchange.
04
Handle processing states
In progress, cancelled, success and failure — with editing locked during generation.
05
Preserve traceability
History records who submitted and when; success and failure affect confirmation dates differently.
06
Support follow-up
Reminders, reconfirmation when data changes, and plan-specific visibility rules.
A screen-by-screen approach wouldn't be enough — the design had to express the full sequence and the rules between steps.
Other journeys addressed
- Adding and maintaining practitioner specialties.
- Managing hospital affiliations and shared organization-owned records.
- Updating professional IDs and state-specific license exemptions.
- Managing practitioners and authorization relationships.
- Uploading, reviewing and replacing supporting documents.
- Generating state-specific applications and roster reports.
- Managing users, permissions and administrative access.
07 · Information architecture
Making a complex profile easier to navigate.
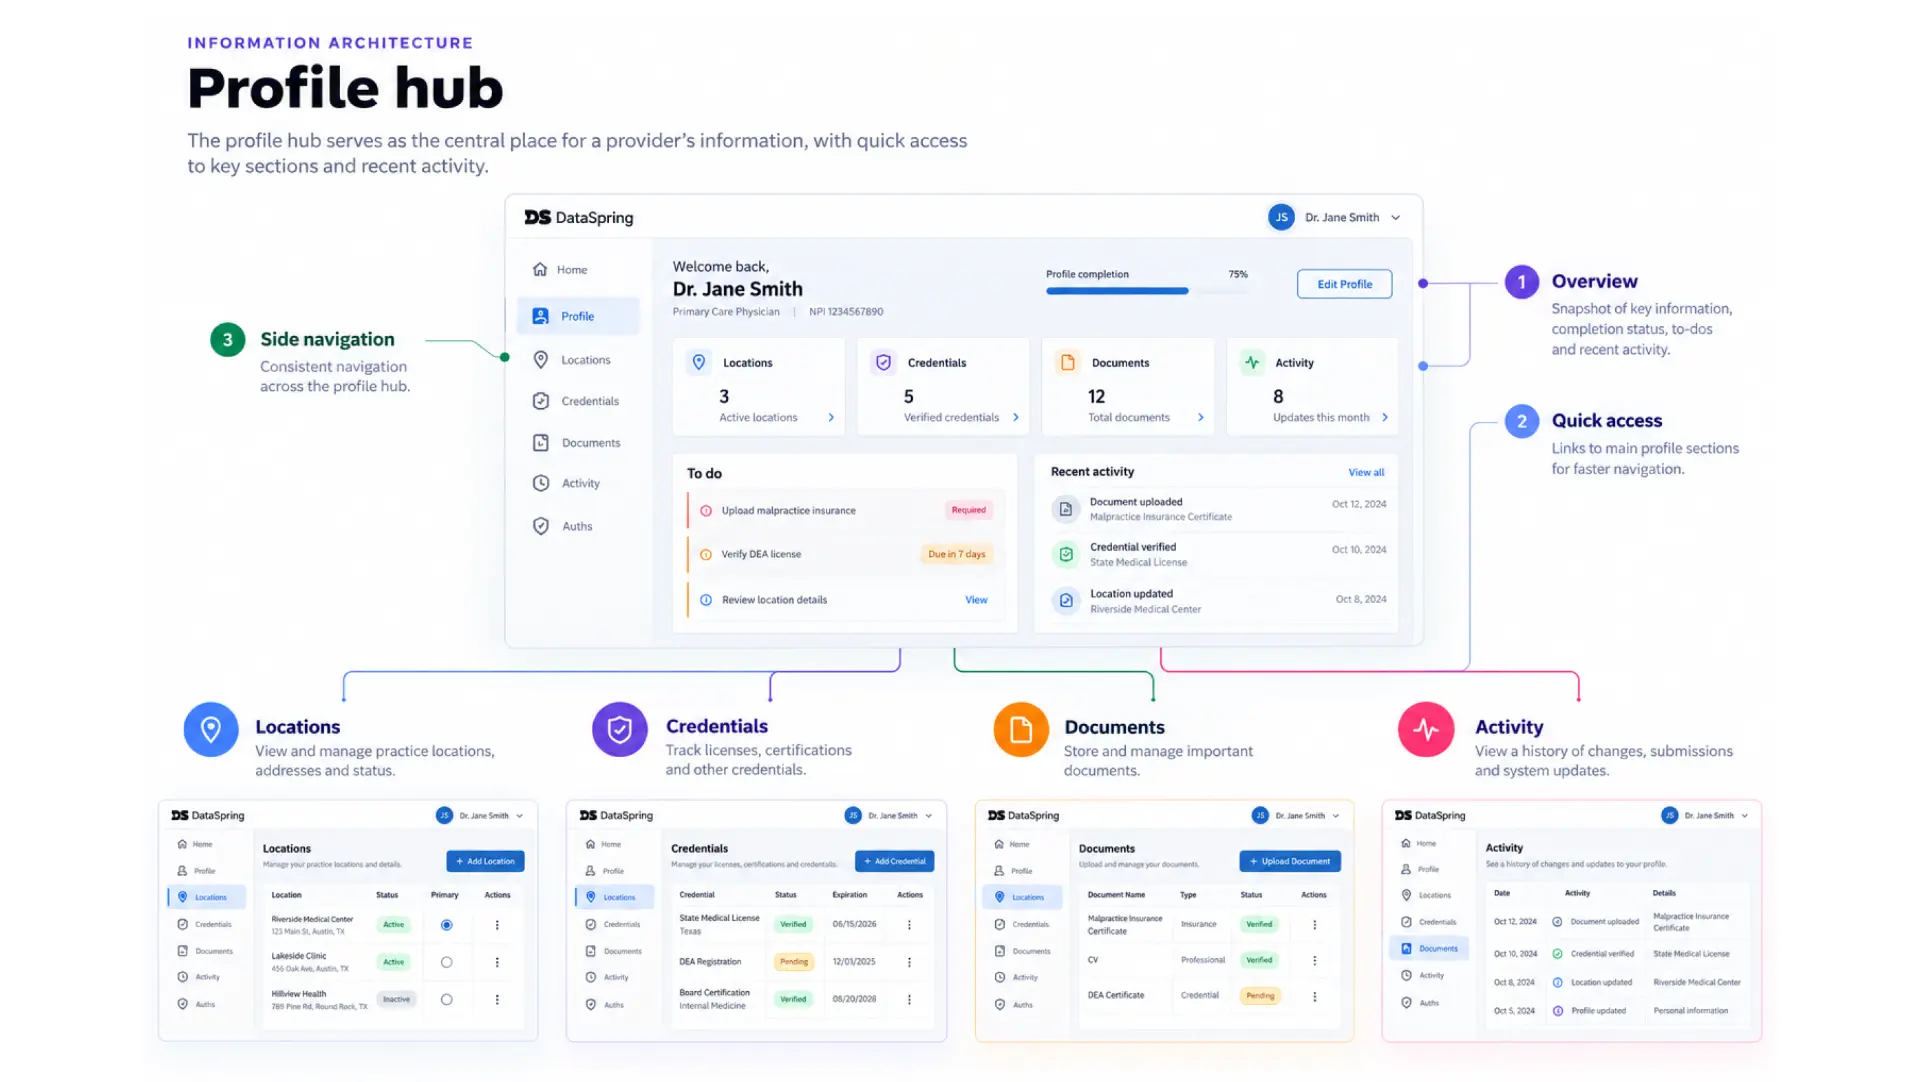
Profile and practitioner hubs bring together summary information, progress, locations, authorization status, documents, to-do items and activity history — giving context at the point of decision while detailed editing stays in its own section.
- Provider identifiers and profile status.
- Specialty and taxonomy information.
- Practice states and location counts.
- Health-plan and authorization relationships.
- Incomplete tasks and outstanding requirements.
- Supporting documents, activity history and confirmation dates.
Designing around ownership
Shared hospital-affiliation records can be managed by an organization and assigned to many practitioners. Organization-managed fields are read-only for practitioners, while certain state-specific fields stay practitioner-editable. Making this explicit removes doubt about who can change a record and what that change affects.
08 · Data integrity & recovery
Validation is part of the experience.
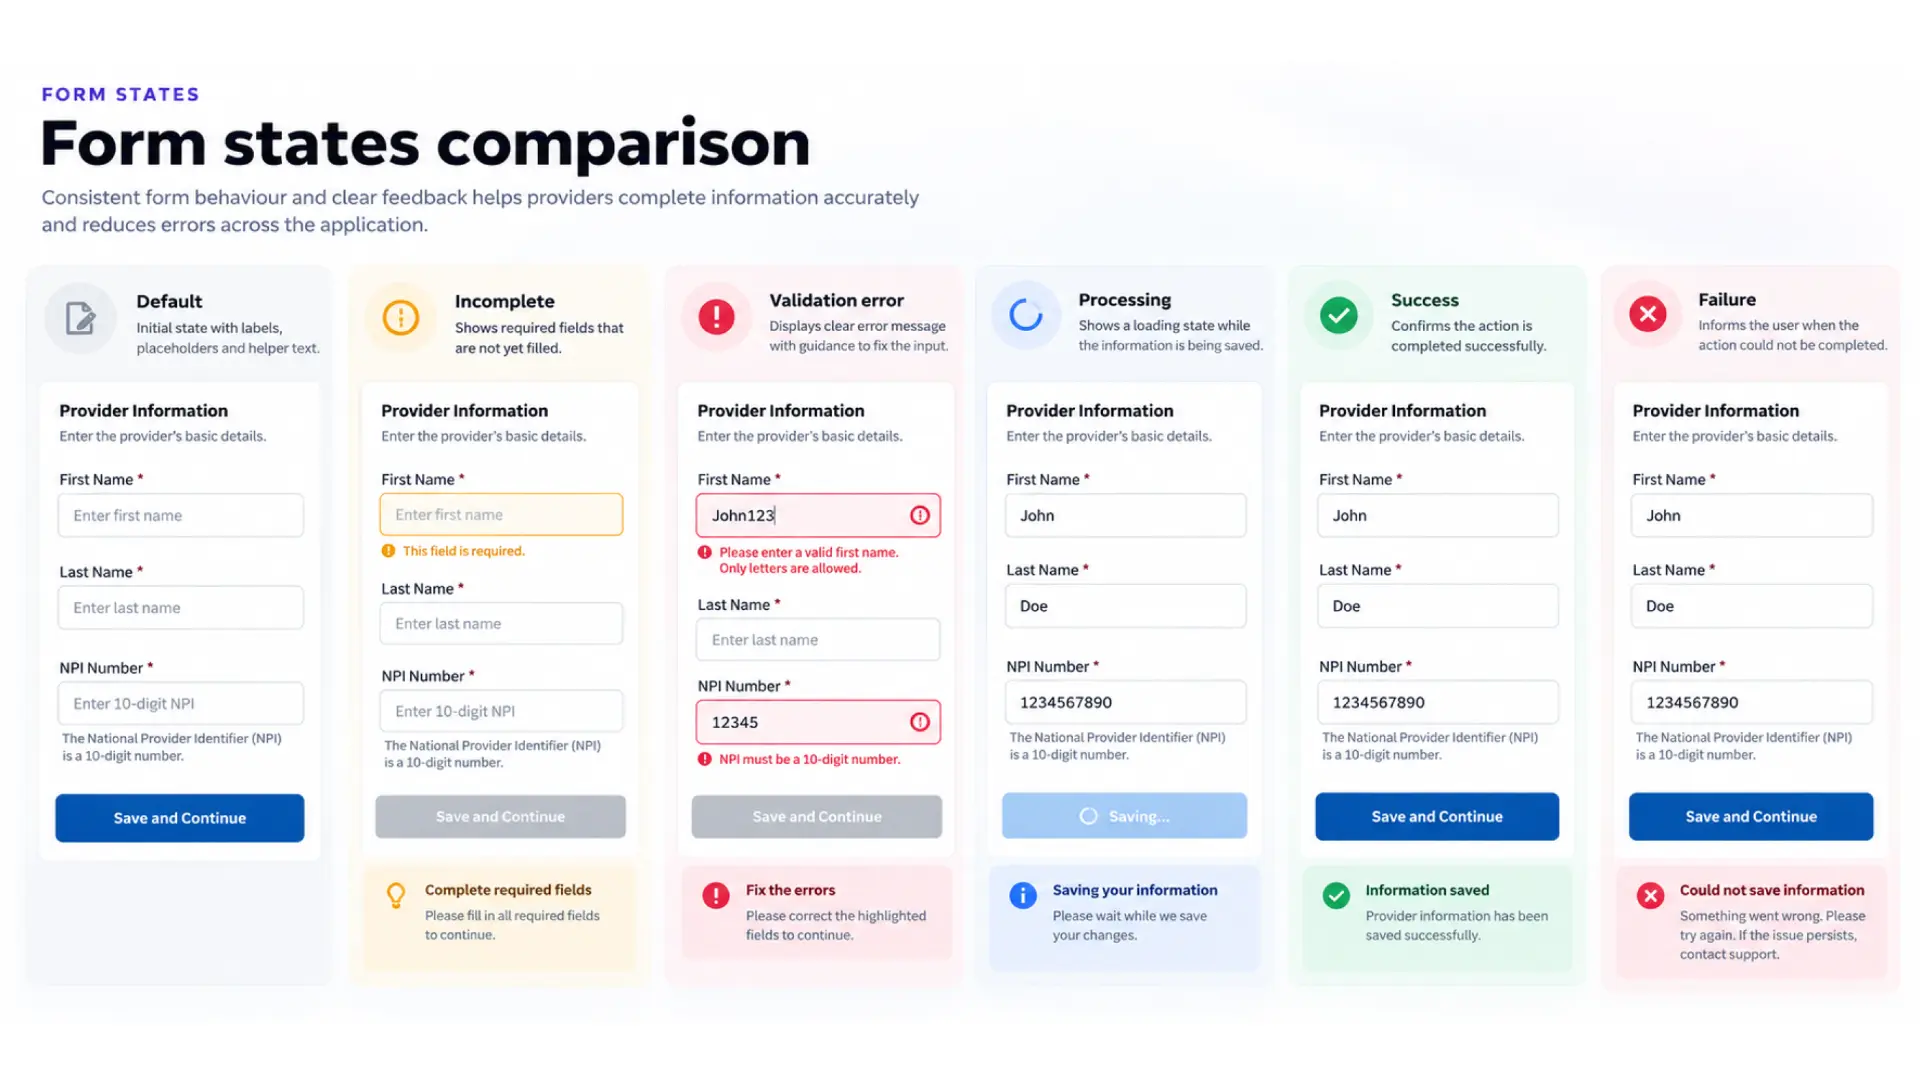
In healthcare data management, one incorrect field can affect downstream workflows. Validation had to be more than a generic error after submit — required fields, duplicate prevention, date dependencies, state rules, address standardization and limits on saving invalid records were designed into form behavior, states and feedback.
Managing specialties
Primary / secondary / additional types, one primary max, no duplicates, conditional board certification, taxonomy links, date and retired-code checks.
OCR-assisted CME entry
Upload, extraction feedback, partial extraction, editable values, manual fallback — saved only after the user reviews and accepts. Fully auditable.
Confirmation & recovery
Clear processing, completed, cancelled and failed states, with a clear next step for each outcome.
Use automation to reduce repetitive work — while keeping people in control of what becomes part of a healthcare profile.
09 · Reusable design system
From individual screens to a consistent product foundation.
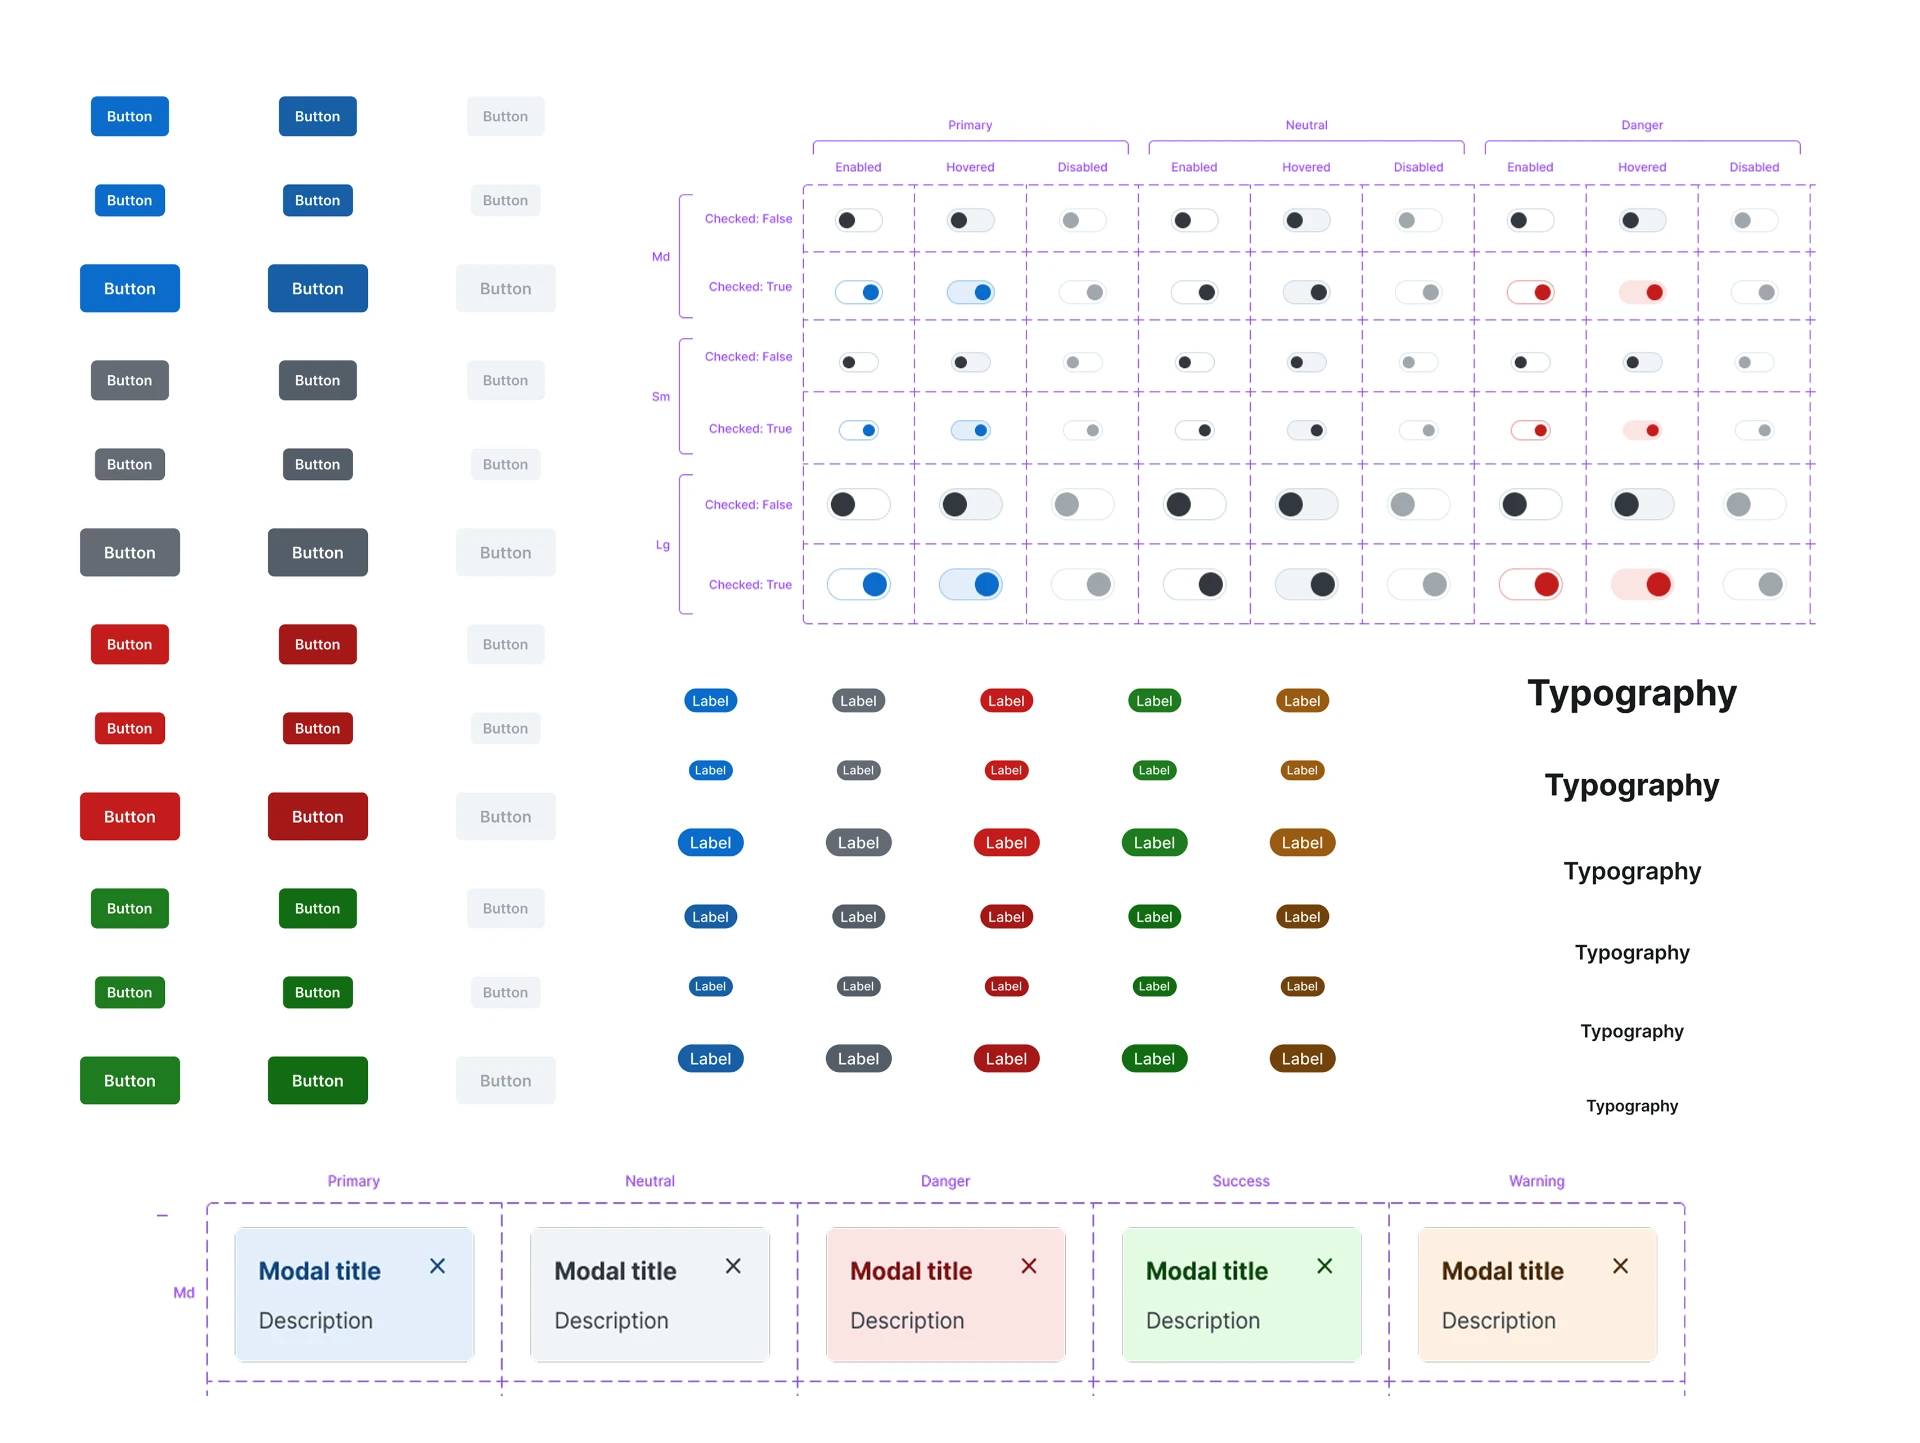
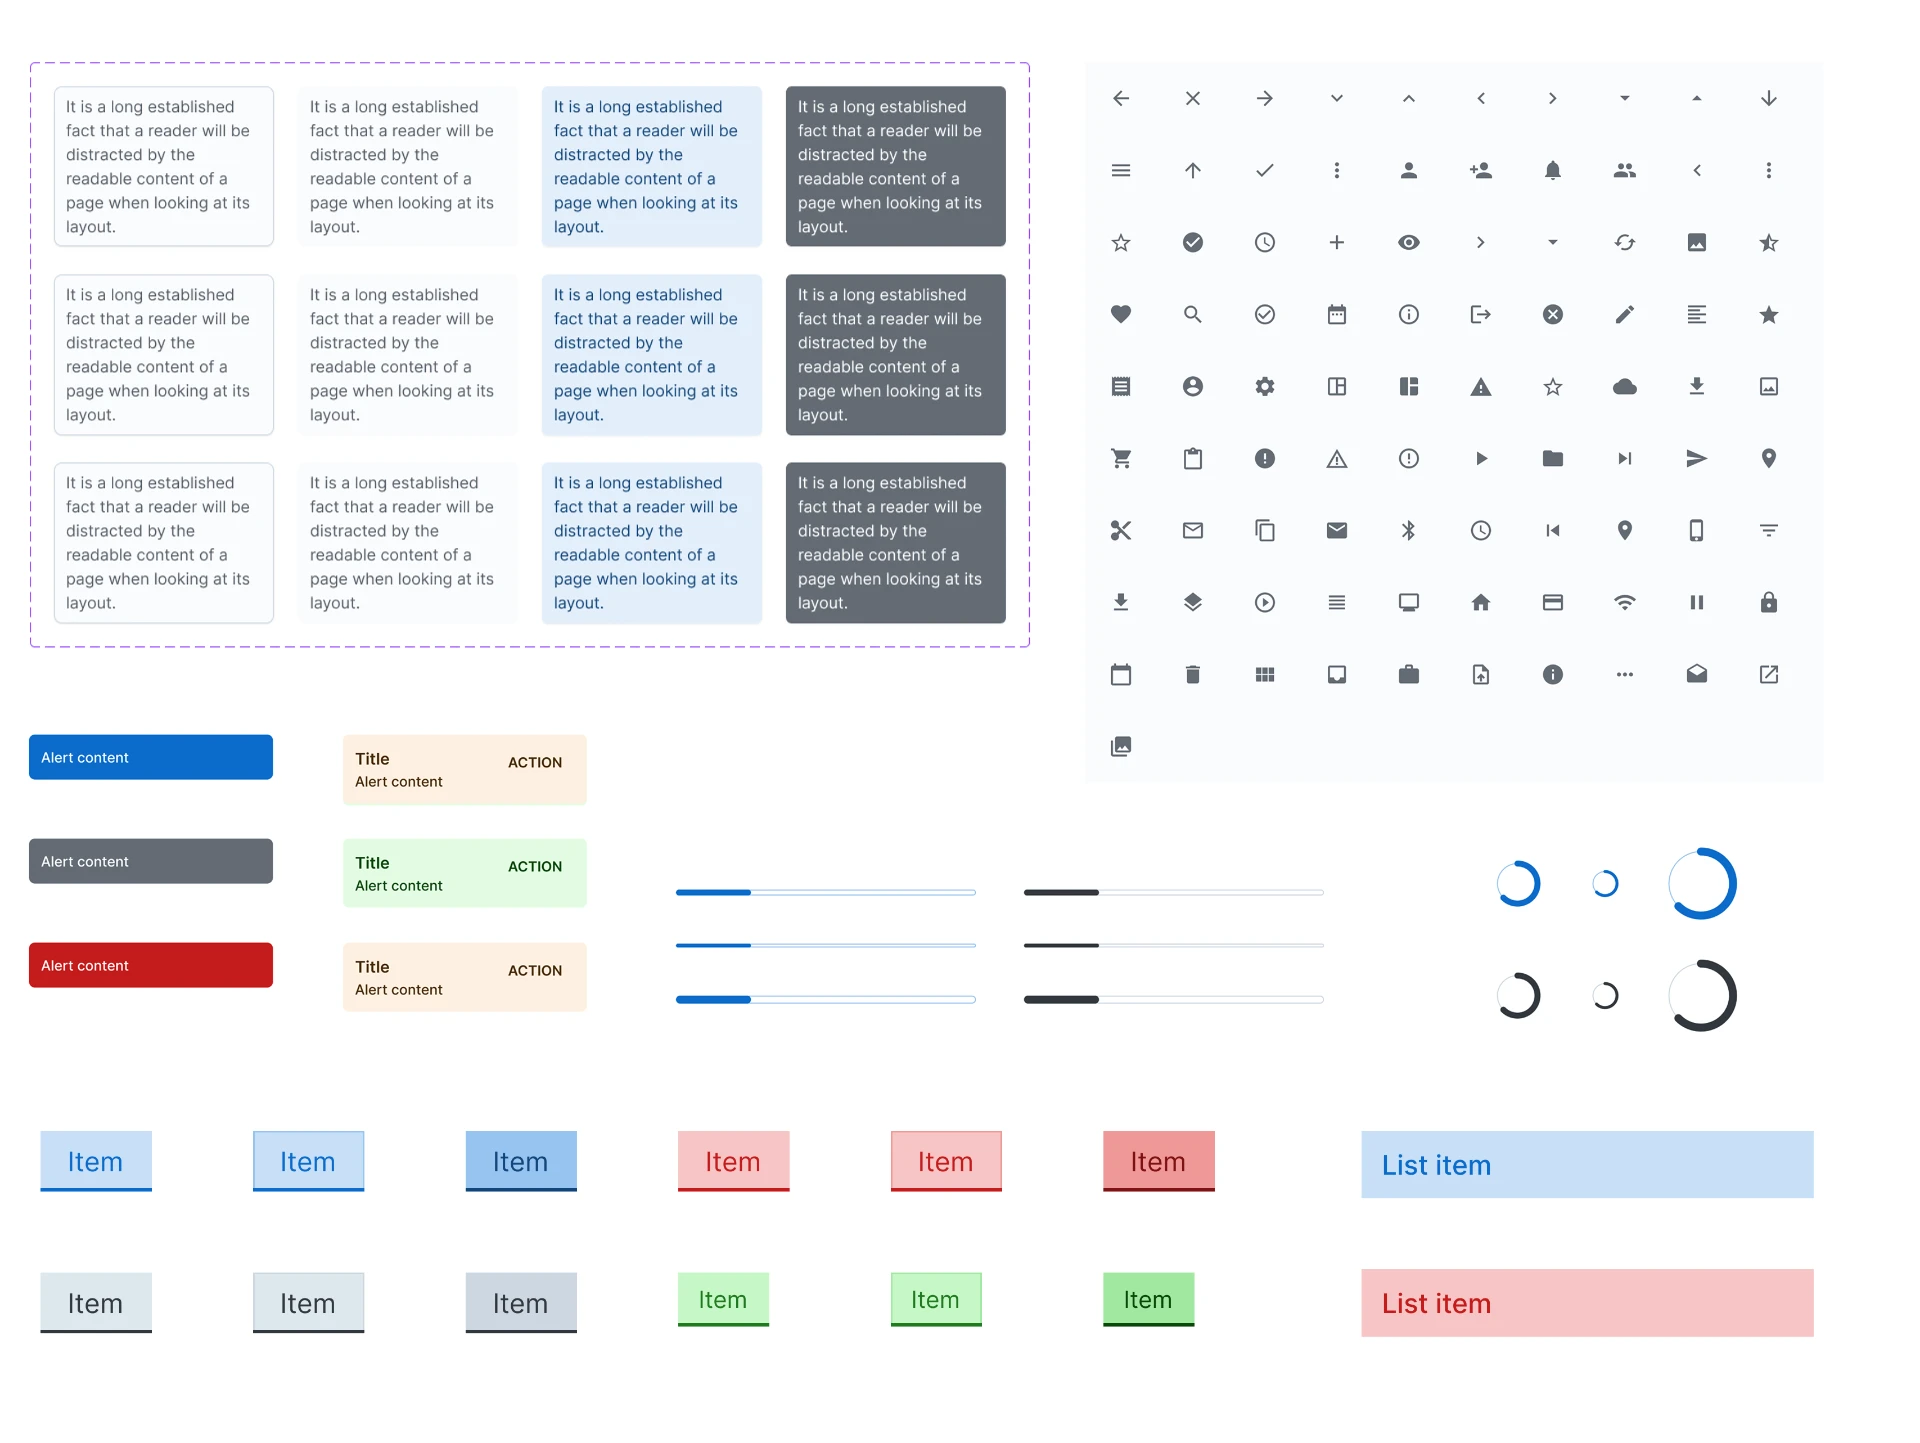
I researched Material UI (MUI) and Material Design patterns, then adapted them to DataSpring's needs and documented reusable components and variants in Figma.
Foundations
- Buttons and form inputs
- Dropdowns, checkboxes, radio buttons
- Tabs, navigation, breadcrumbs
- Modals, alerts, tooltips, confirmation dialogs
- Typography, spacing and layout rules
- Validation messages and status indicators
Product patterns
- Provider-profile sections
- Credential and status patterns
- Document upload
- Review and confirmation
- Form-validation states
Components covered behavior, not just appearance: an input looks and behaves the same across normal, focused, invalid, disabled and completed states, and a status indicator means the same thing everywhere.
Accessibility built in
Requirements referenced WCAG 2.1 AA and 2.2 AA across features. Keyboard navigation, screen-reader support, contrast and touch targets were part of the component specs — not a final-stage check.
10 · Designing across breakpoints
Extending the experience beyond desktop.
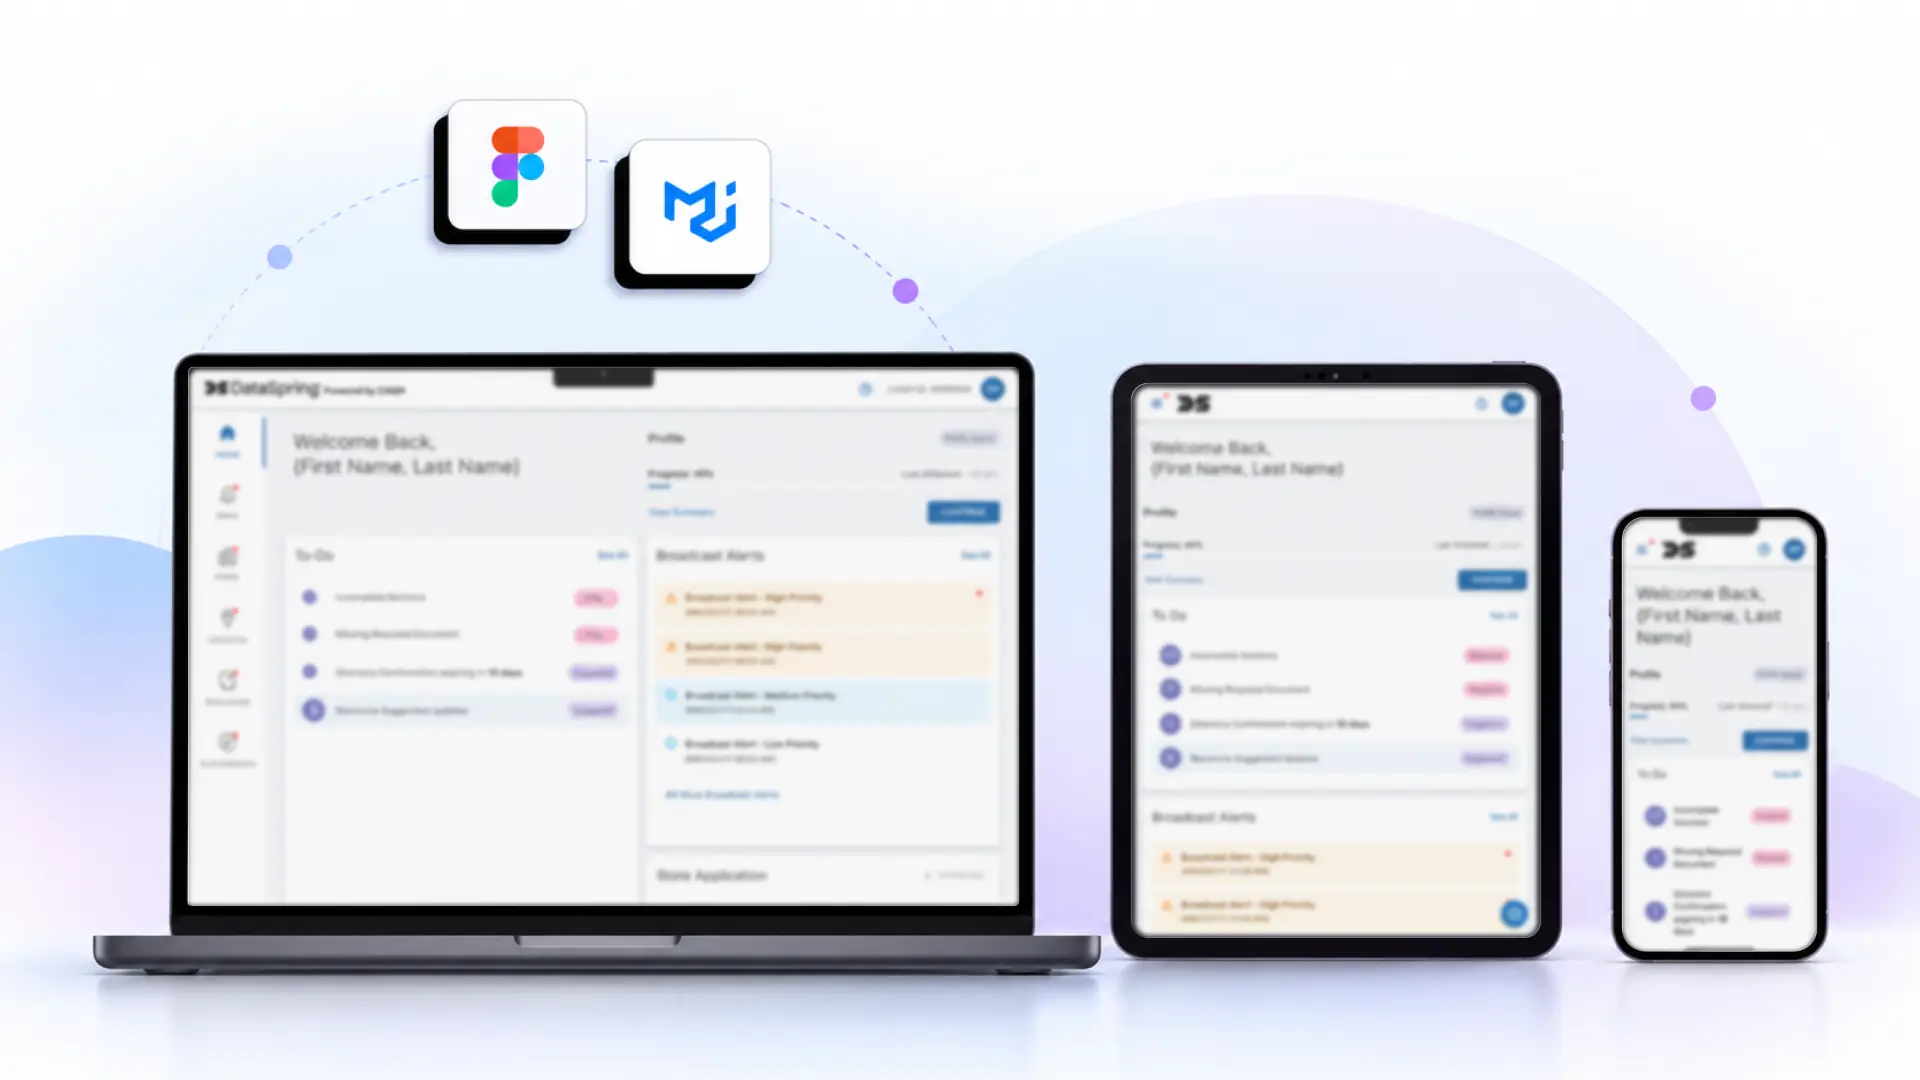
Responsive Design — One Experience Across Three Breakpoints
The DataSpring Provider Data Portal was designed to deliver a consistent experience across desktop, tablet, and mobile devices. Starting with a desktop-first interface, I adapted the layout, navigation, and content hierarchy to suit different screen sizes while maintaining a familiar interaction pattern.
The goal was to maintain consistency, readability, and access to essential workflows across breakpoints, rather than simply scaling down the desktop interface.
Design principle: One connected experience, adapted to every screen.
The initial direction was desktop-only. As scope grew to tablet and mobile, I reviewed the component system, found gaps in responsive behavior, and defined adaptations for navigation, buttons, forms and other key components — adapting, not just shrinking.
Desktop
Desktop (1025px and above): Uses the available screen space to present provider information, profile progress, to-do items, and alerts in a structured dashboard layout.
Tablet
Tablet (577px–1024px): Adapts the dashboard to a narrower viewport while keeping key information and actions accessible.
Mobile
Mobile (up to 576px): Prioritizes essential information and vertically organizes dashboard content for smaller screens.
11 · Designing for implementation
Connecting design intent to engineering requirements.
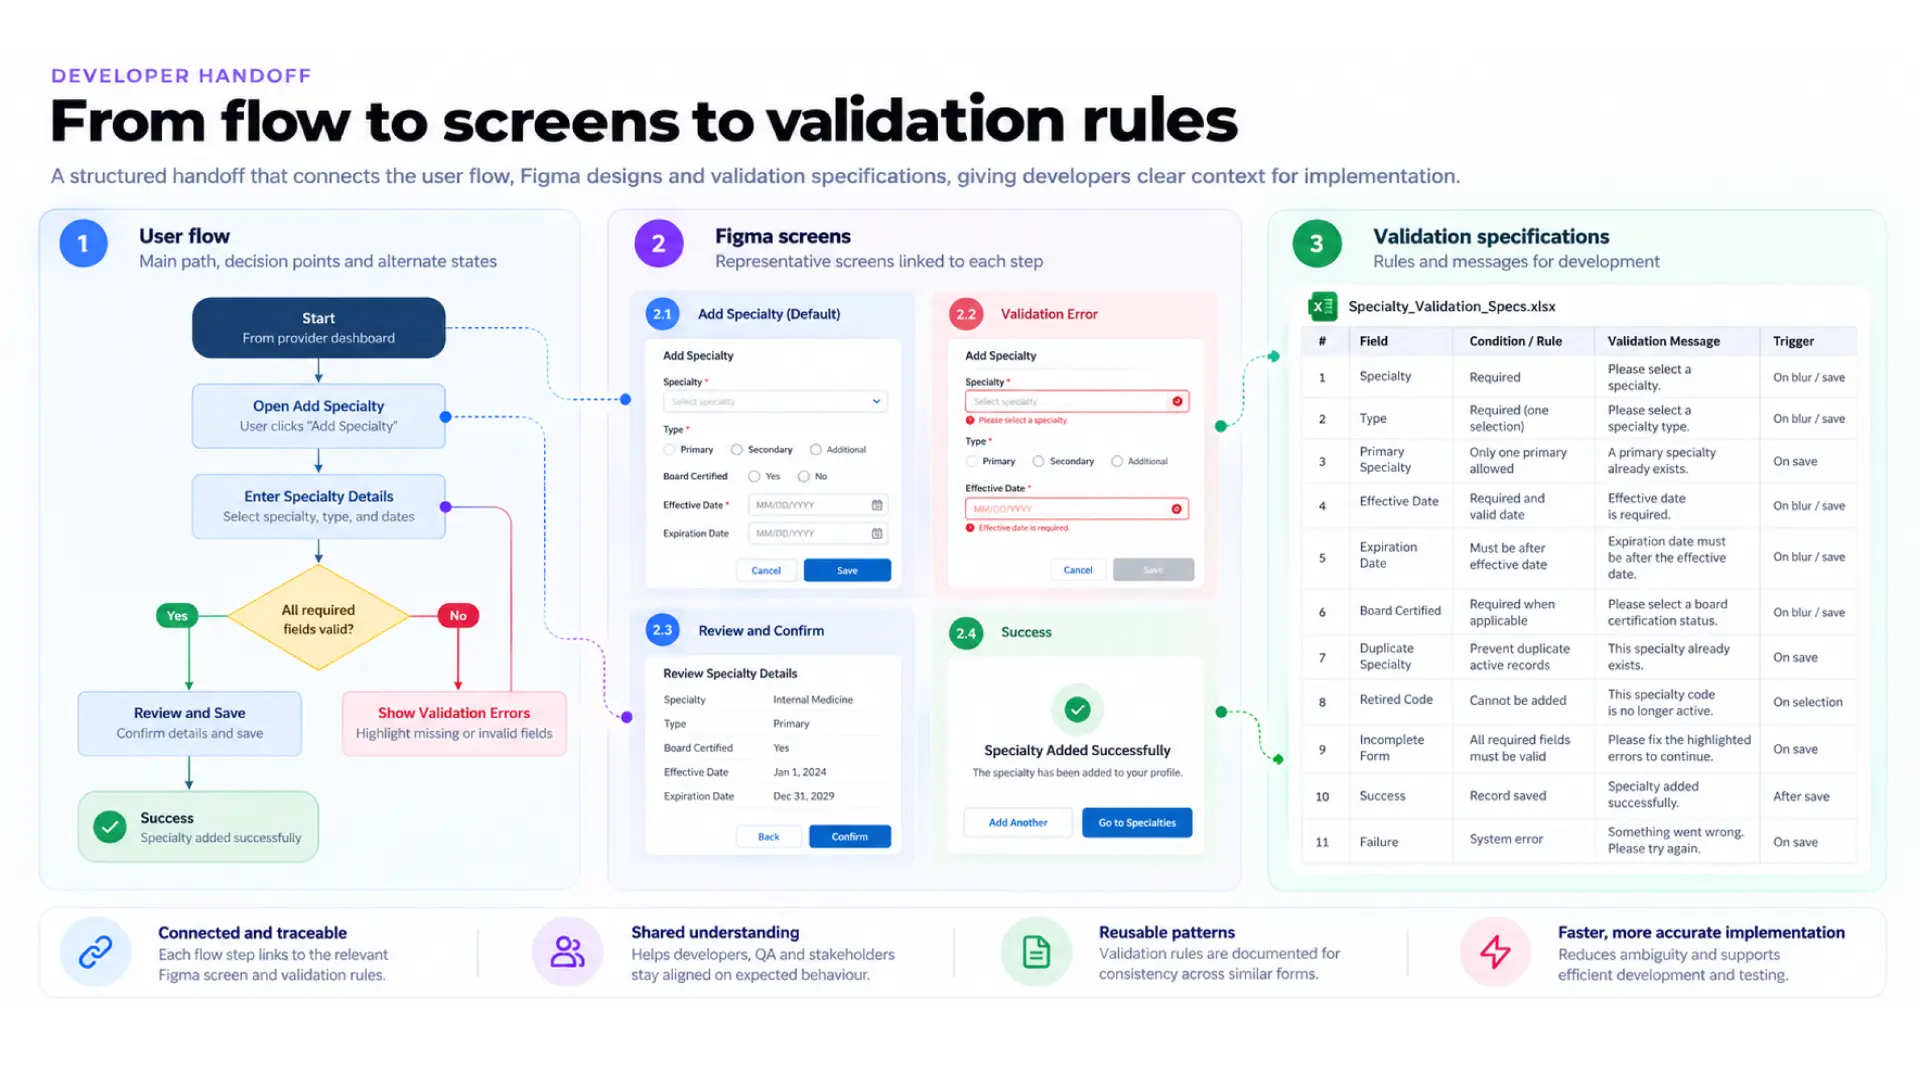
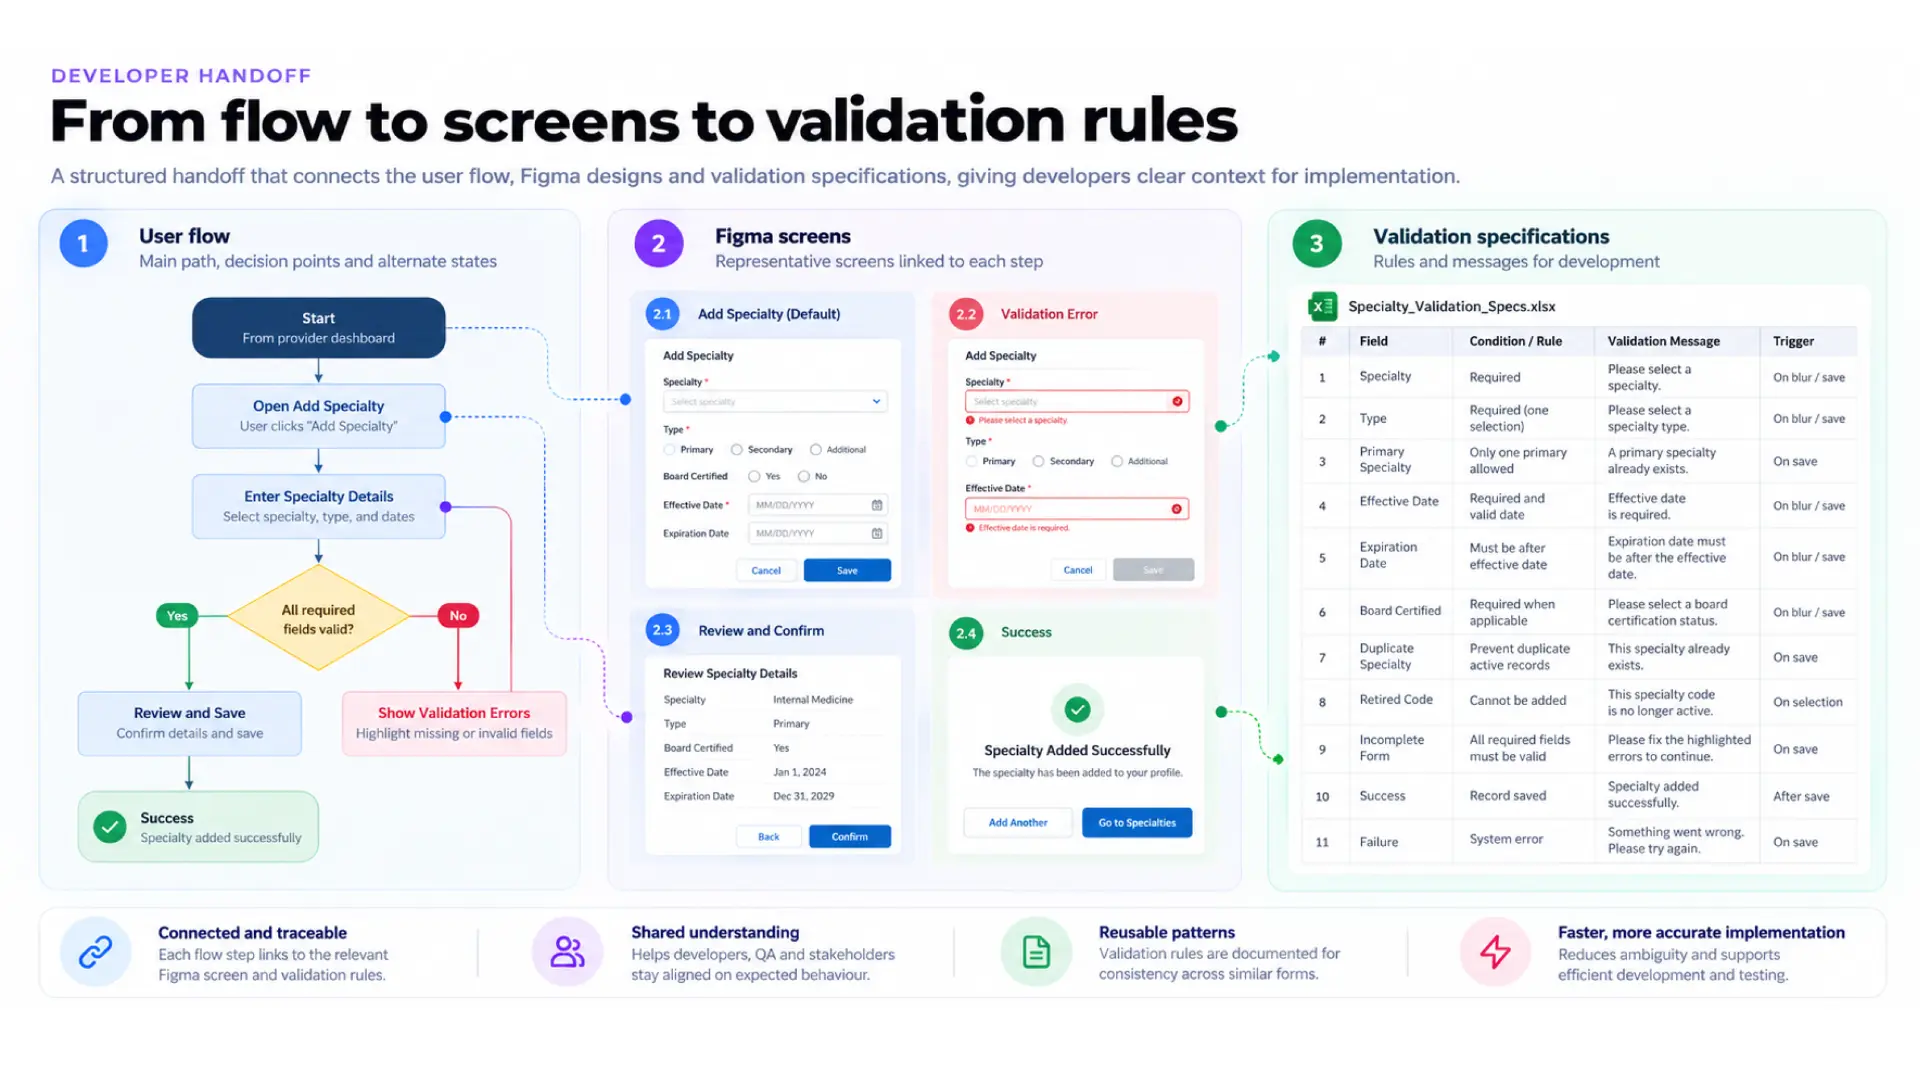
A high-fidelity screen doesn't explain what happens when data is missing, a user lacks authorization, validation fails or a workflow is cancelled. I supported developers with feature walkthroughs, user-flow documentation and validation specifications.
- Identified gaps in the initial designs.
- Created happy-path user flows for core journeys.
- Walked developers through screens, interactions and expected behavior.
- Documented validation points and system messages in a structured spreadsheet.
- Reviewed specifications with the client before sharing with developers.
- Supported UX testing and follow-up fixes after development.
12 · AI-assisted development
Making design intent understandable to AI tools.
As the team explored AI-assisted development, the link between Jira acceptance criteria and Figma designs wasn't explicit enough for AI tools to follow reliably. I helped create a structured connection across three layers.
Layer 1 · Jira acceptance criteria
What the feature must do, including conditions and expected behavior.
Layer 2 · User-flow diagrams
Entry points, decision points, alternate paths and exit conditions.
Layer 3 · Figma designs
The screens and interaction states that express the intended experience.
- Which flow implements a given requirement.
- Which screens support each step.
- What happens when a condition isn't met.
- Where a design or requirement needs clarification.
- Which states to consider in implementation and QA.
Tools including Claude Code and Figma Make were part of the broader design and delivery experimentation.
The value isn't using AI to generate interfaces — it's structuring product knowledge so people and AI tools can both follow the intended logic.
13 · UX validation & QA
Checking the built experience against the intended one.
Visual validation
Spacing, alignment, color, typography, component behavior, responsive layouts and pixel-level differences from Figma.
End-to-end flow testing
Whole journeys: navigation, transitions, error states, edge cases and state management.
Accessibility checks
Contrast ratios, touch-target sizes, keyboard interaction and screen-reader support.
Structured defect resolution
I worked with QA to log issues in Jira, coordinated fixes with developers, and retested before demos.
Key learning: visual validation works best when it starts early, and end-to-end testing catches issues that isolated screen checks miss — especially where permissions, conditional states and connected workflows meet.
14 · The resulting design direction
A structured foundation for a complex healthcare platform.
- A responsive provider-dashboard experience across desktop, tablet and mobile.
- A reusable MUI-based component foundation in Figma.
- User flows for core provider and administrative journeys.
- Designs for profiles, credentials, locations, authorizations, documents and admin workflows.
- Validation and system-message specifications for development.
- Structured links between acceptance criteria, user flows and Figma screens.
- A repeatable visual QA and defect-resolution process.
15 · Impact & evidence
What the evidence supports.
| Design scope | 1,000+ screens |
|---|---|
| Duration | 9+ Months |
| Responsive design | Desktop, tablet and mobile designs |
| Design system | Reusable components, variants and patterns in Figma |
| Handoff | Feature walkthroughs, user flows and validation specs |
| Quality assurance | Visual and end-to-end UX testing, Jira tracking and retesting |
| Product outcome | Post-launch metrics not yet available |
Worth measuring after release
- Time to complete provider-profile updates.
- Completion and abandonment rates for key workflows.
- Frequency of validation errors and duplicate records.
- Roster-submission success and failure rates.
- Time to resolve incomplete profiles.
- Support requests related to profile management.
- Task completion and accessibility issues across devices.
16 · Collaboration
Delivered with a wide, cross-functional team.
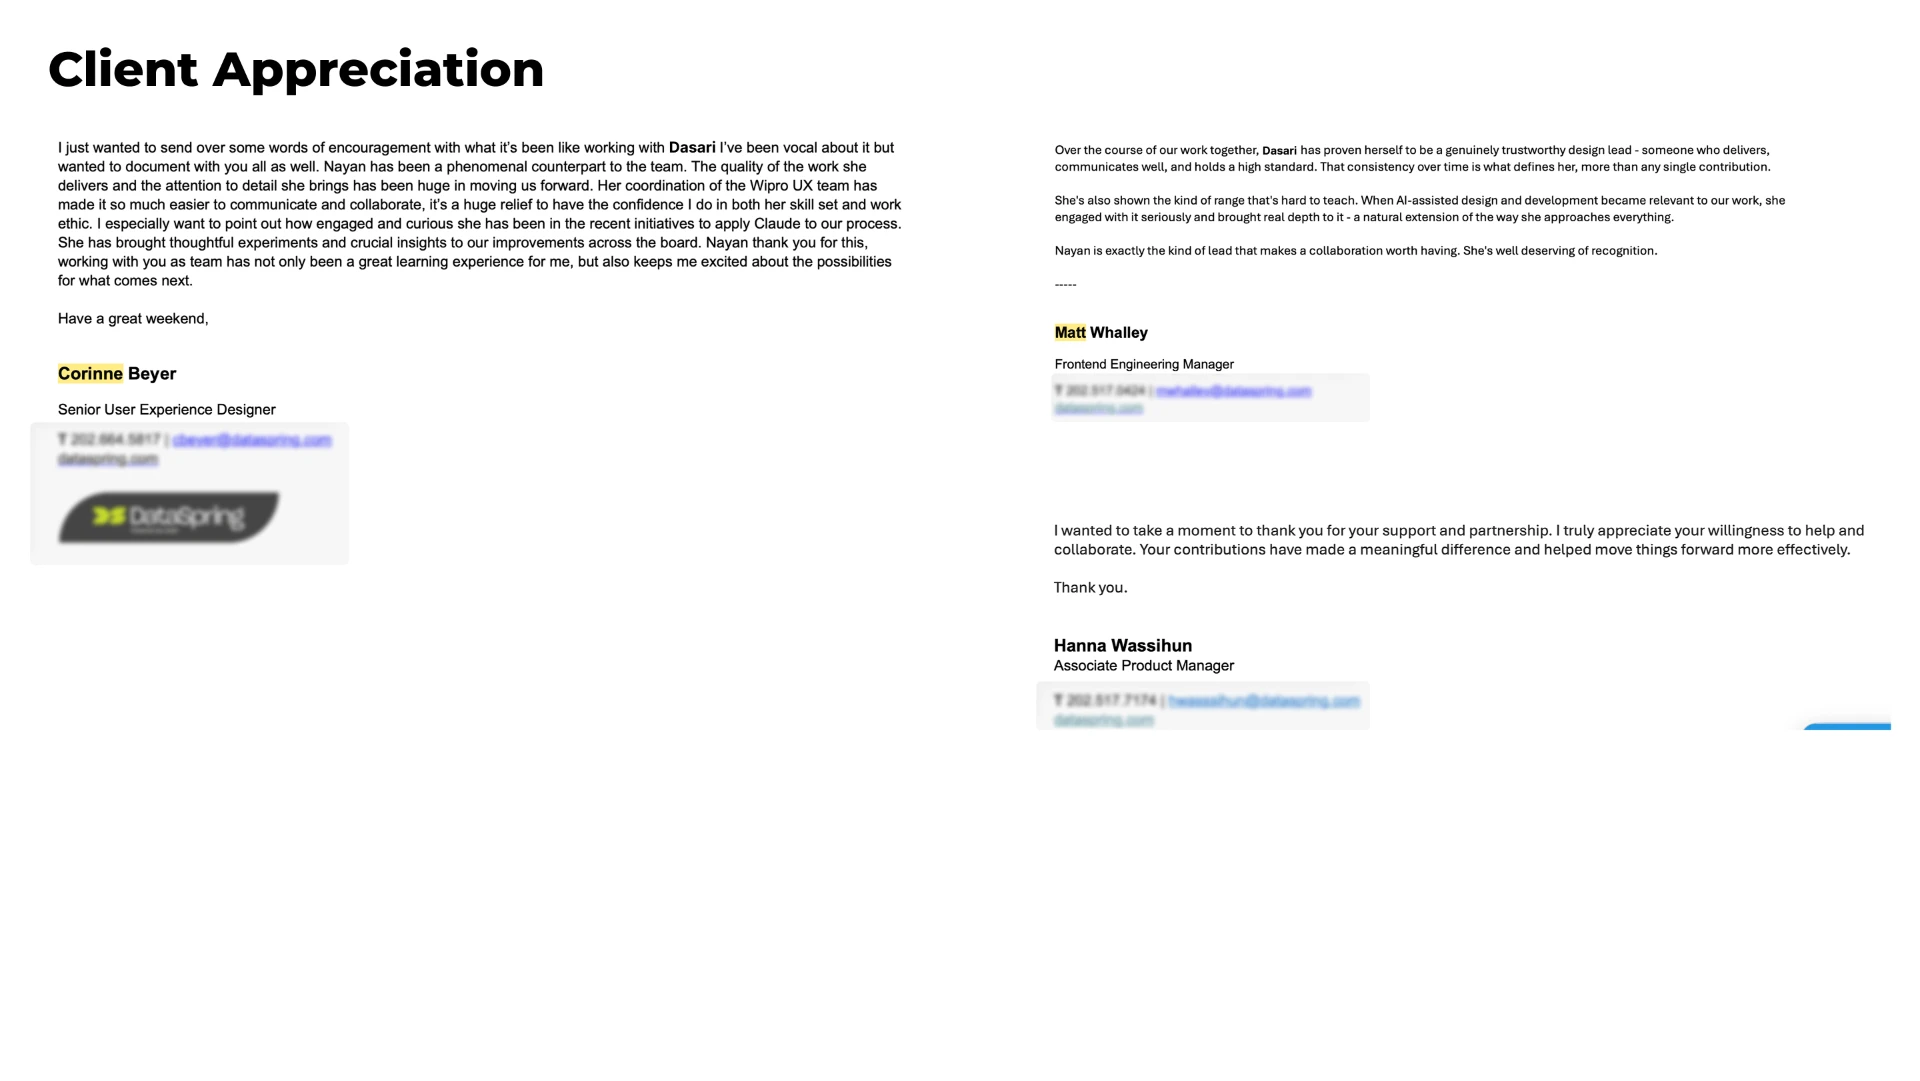
The project needed ongoing coordination across design, business analysis, product, engineering, QA, subject-matter experts and client stakeholders. DataSpring stakeholders shared written appreciation for collaboration, communication, consistency, attention to detail and engagement with AI-assisted initiatives.
17 · Reflection
What I learned designing at enterprise scale.
Requirements become experiences, not screens
An acceptance criterion must be translated into decisions, feedback and predictable outcomes.
Design systems are operational tools
They set shared expectations for behavior, accessibility and implementation across teams.
Handoff is part of design
Validation, permissions, errors and alternate paths are part of the experience.
AI needs structured product knowledge
Connecting criteria, flows and screens makes intent easier to inspect, explain and build.
Quality must be continuous
A repeatable cycle of review, validation, tracking and retesting keeps small issues from piling up.
18 · Closing
Good enterprise UX isn't about hiding complexity — it's about organizing it so people can understand it, act on it, and trust the system.
This project taught me to think beyond individual interfaces — to see how information, permissions, validation rules, responsive patterns and downstream workflows fit together as one system, and to create clarity for users, stakeholders and developers alike.
Next case